Karthick Raja Data Analyst | Power BI Developer

SQL · Power BI · DAX · Python · Azure

Data Analyst & Power BI Developer with 1.5+ years of experience in SQL, Power BI, DAX, Power Query, Azure, Excel, and data modeling. Experienced in building KPI dashboards, executive reports, and BI solutions across sales, banking, and supply chain. Tracked AED 15M+ in commercial opportunities and reduced reporting turnaround time by 70%. Based in Dubai, UAE, available immediately.

0+
Projects delivered
0+
Certifications
0+
Years experience
Portrait of Karthick Raja
Power BI · SQL Specialist
About me

A data person who designs for clarity

I combine analytical thinking with practical business understanding to turn complex datasets into clear, reliable reporting. My work spans data transformation, validation, semantic modeling, KPI development, and dashboard design, with a focus on making information easier for teams and decision-makers to understand and act on.

Profile

  • NameKarthick Raja
  • RoleData Analyst & Power BI Developer
  • StatusOpen to Full-Time Roles
  • LocationDubai, UAE (Available Immediately)
  • EducationB.E. Computer Science & Engineering
  • LanguagesEnglish, Tamil, Malayalam
  • FocusBusiness Intelligence, Semantic Modeling & Automation

Core Competencies

Focus areas demonstrated through projects, experience, and certifications.

Power BI & Microsoft Fabric Advanced
SQL, CTEs & Query Optimization Strong
DAX & Star Schema Modeling Advanced
Data Visualization & KPI Design Advanced
Power Automate & Power BI Gateway Strong
Python (Pandas, NumPy) & Azure Working Knowledge
Experience

Work history

From hands-on analytics to UAE business reporting — a timeline of the roles that have shaped my craft.

Jan 2026 – Jul 2026 Besant Technologies · Chennai, India

Data Analyst Intern

End-to-End BI & Data Pipelines
  • Built end-to-end BI reporting solutions across Retail, Banking, and Supply Chain datasets, covering data extraction, cleansing, validation, and Power BI reporting.
  • Conducted Exploratory Data Analysis (EDA) using SQL and Python (Pandas) to identify sales trends and customer churn indicators.
SQL Transformation & Validation
  • Used SQL with CTEs, joins, window functions, and aggregations to clean, validate, and standardize 500K+ transactional records.
  • Improved data accuracy and cross-system consistency.
Scheduled Automation & Gateways
  • Configured scheduled data refresh automation through Power BI Gateway, reducing reporting delays by 35%.
Power BI SQL Python Pandas ETL Pipelines Power BI Gateway Star Schema Advanced Excel
May 2025 – Nov 2025 Enjay Engineering Services · Dubai, UAE (Remote)

Power BI Developer

Commercial Pipeline & Stakeholder Collaboration
  • Collaborated with business stakeholders to define reporting requirements, commercial KPIs, and executive dashboard layouts.
  • Designed and maintained Power BI dashboards delivering executive and project-level KPI reporting for engineering quotation and commercial pipeline performance.
  • Gave regional leadership visibility into AED 15M+ in active opportunities across UAE emirates.
  • Analyzed regional product demand, steel volumes, pricing, and margins to identify margin trends and underperforming opportunities.
Data Modeling & DAX Architecture
  • Built Star Schema data models and 30+ DAX measures covering time intelligence, YoY growth, conversion rates, and quotation aging.
  • Supported engineering project performance reviews and executive reporting.
ETL Automation & Power Query
  • Automated weekly quotation reporting workflows using Power Query, eliminating 12+ hours of manual effort per week.
  • Reduced reporting turnaround time by 70% while reducing manual reporting errors through automated validation workflows.
Governance & Row-Level Security
  • Implemented Row-Level Security (RLS) to provide role-specific branch-level access for regional sales managers, strengthening reporting governance.
Microsoft Fabric Power BI DAX Power Query SQL Azure Star Schema Row-Level Security
Education

Academic background

2022 – 2026

Bachelor of Engineering in Computer Science & Engineering

Hindusthan Institute of Technology, Coimbatore, Tamil Nadu, India

Focus: Business Intelligence & Data Engineering · Medium: English

2020 – 2022

Higher Secondary Certificate (HSC)

Sri Ramakrishna Matric Hr Sec School, Perambalur, Tamil Nadu, India

Stream: Computer Science · Grade: 76.3% · Medium: English

2012 – 2020

Secondary School Leaving Certificate (SSLC)

St. Paul's Matric Hr Sec School, Tamil Nadu, India

Grade: 92% · Medium: English

Credentials

Certifications

Continuously levelling up across business intelligence, cloud data, and AI analytics.

Microsoft

Microsoft Power BI Data Analyst

Microsoft Certified

Google

Google Business Intelligence

Professional Certificate

Microsoft

Microsoft Azure Fundamentals (AZ-900)

Cloud & Data Infrastructure

IBM

Generative AI for Data Analysts

IBM Certified

View all credentials on LinkedIn →
Technical Expertise

Skills & Capabilities

A focused, industry-aligned skillset spanning Power BI & Fabric architecture, SQL optimization, Azure cloud pipelines, and business analysis.

Power BI, Fabric & Azure

Power BI · Fabric · Cloud Pipelines

End-to-end dashboard design, semantic modeling, DAX, Microsoft Fabric, Azure data services, and automated ETL pipelines.

Power BI Desktop & Service Advanced DAX Measures Semantic Model Design Power Query & M Microsoft Fabric Incremental Refresh Deployment Pipelines Row-Level Security Performance Optimization Azure Data Factory

SQL & Data Analytics

Query Optimization · Modeling · QA

Relational database querying, query tuning, CTEs, window functions, dimensional modeling (Star & Snowflake schemas), and QA validation.

SQL (MySQL, PostgreSQL, T-SQL) Query Optimization CTEs & Window Functions Joins & Subqueries Stored Procedures & Views Star & Snowflake Modeling Data Validation & QA Time Intelligence

Python, Excel & Business Analysis

Pandas · Requirements · Storytelling

Python data manipulation, advanced Excel modeling, business requirements discovery, root-cause diagnostics, and executive data storytelling.

Python (Pandas, NumPy) Data Cleaning & EDA API Data Extraction Advanced Excel & Power Pivot Business Requirements Gathering KPI Definition & Ad-hoc Analysis Root Cause Analysis Stakeholder Data Storytelling Data Visualization Statistical Analysis
0+
Analytical Projects
0+
Certifications
0K+
Records Analyzed
0+
Languages Spoken
Selected work

Featured Projects

A collection of interactive Power BI dashboards, ETL pipelines, and data applications.

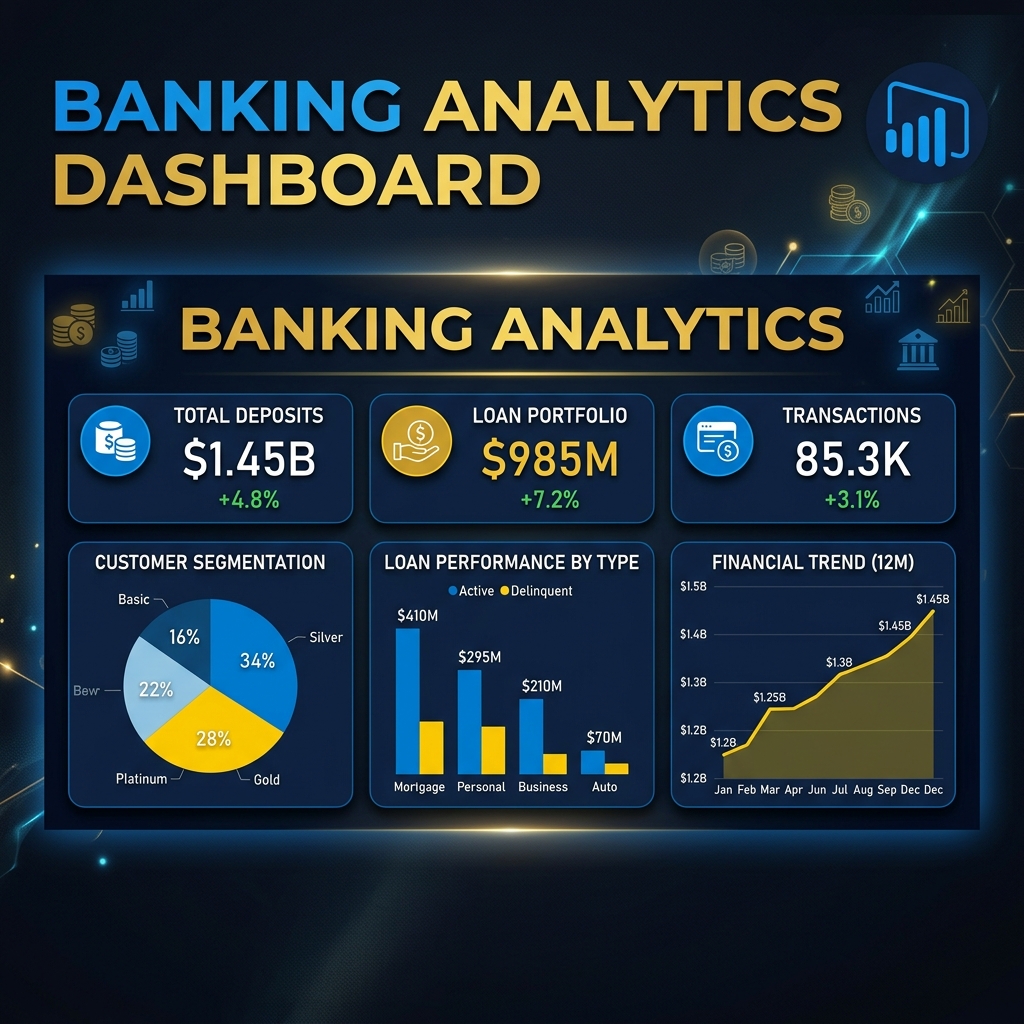
Banking Performance dashboard preview

Banking Performance Dashboard

Analyzed ₹4.87B in transaction value across 150K+ records, identifying high-failure transaction segments and risk factors with SQL validation and Power Query ETL.

Power BI SQL Financial Analytics
Live Dashboard
View all 9+ projects on LinkedIn → View GitHub →
Case study

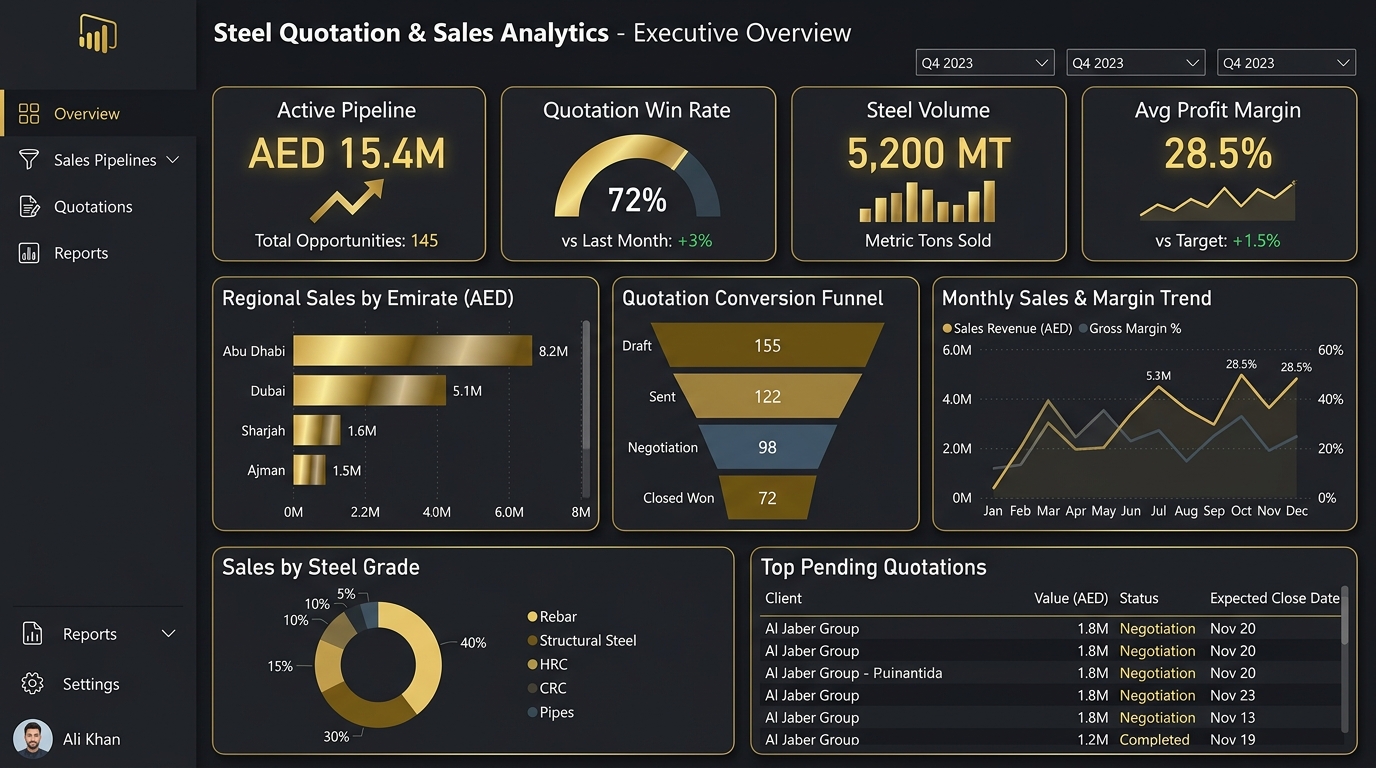
Steel Quotation & Sales Analytics

Turning manual commercial reporting into a decision-ready Power BI workflow.

AED 15M+pipeline tracked
70%faster reporting
  1. ProblemCommercial teams relied on manual Excel compilation and delayed status updates.
  2. ApproachBuilt Power Query transformations, a star schema, and reusable DAX measures.
  3. SolutionDelivered a five-page dashboard covering funnel, region, win/loss, and margin views.
  4. OutcomeSaved 12+ hours each week and gave leadership a consistent view of active opportunities.
Case study

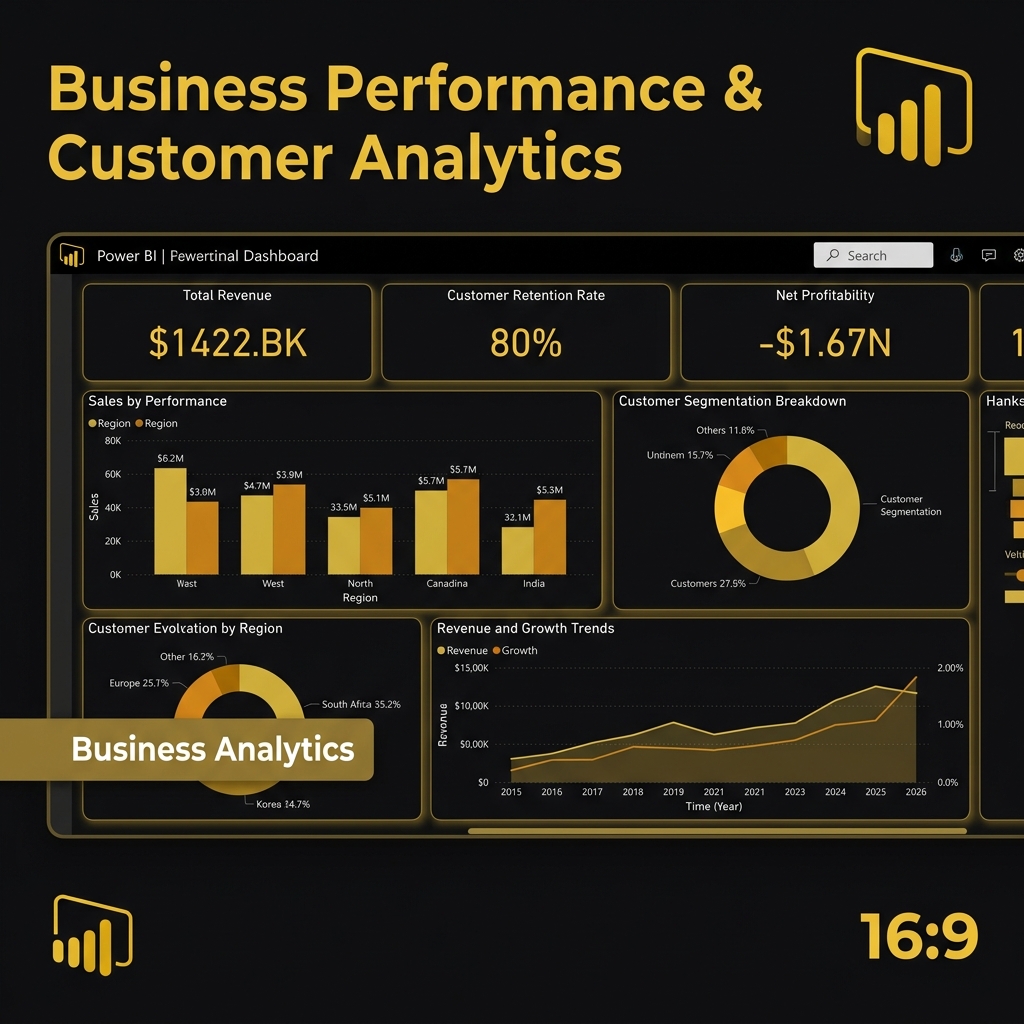
Business Performance & Customer Analytics

Making revenue, profitability, and customer retention patterns easier to act on.

$2.3Mrevenue analyzed
9,994orders analyzed
  1. ProblemLeadership needed one view of revenue, profit, customer retention, and year-to-date performance.
  2. ApproachCreated a star schema with reusable DAX measures for growth, margins, cohorts, and customer value.
  3. SolutionBuilt interactive KPI pages with slicers, drill-through, cohort analysis, and tooltip cards.
  4. OutcomeEnabled faster comparison of customer segments, retention patterns, and business performance trends.
Case study

Banking Performance Dashboard

Turning high-volume transaction data into clearer financial risk and performance signals.

₹4.87Btransaction value
150K+records analyzed
  1. ProblemLarge transaction volumes made it difficult to identify failure patterns, defaults, and liquidity signals.
  2. ApproachUsed SQL CTEs, joins, window functions, and Power Query transformations for validation and analysis.
  3. SolutionDesigned financial KPI views covering transaction volume, failure rates, loan defaults, and liquidity.
  4. OutcomeGave users dynamic risk-segment views for investigating high-failure and abnormal transaction patterns.
Get in touch

Let's talk

Always happy to discuss analytics, dashboard design or new opportunities.

Location

Dubai, United Arab Emirates

Have a question?

Drop me a message and I'll get back to you as soon as I can.